Grafana is open source graphing dashboard visualization and analytics software. It allows you to query, visualize, alert on, and explore your metrics no matter where they are stored. In plain English, it provides you with tools to turn your time-series data (TSDB) into a beautiful dashboard with graphs and visualizations.
FirstLight Technologies offers an all-encompassing solution for your data visualization needs. We provide expert level support and engineering to create a custom solution for your workflows. All of the network monitoring platforms that we work with can be seamlessly sewn into an aggregate display for NOCs, reporting, and forecasting purposes.
We can work with your team on migrating any existing platforms that our clients use and designing new products to make Grafana’s dashboards work for your needs.
Grafana Tools
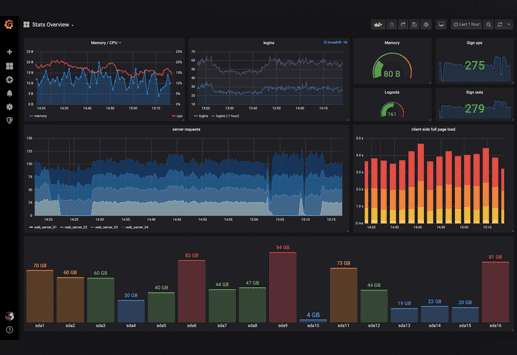
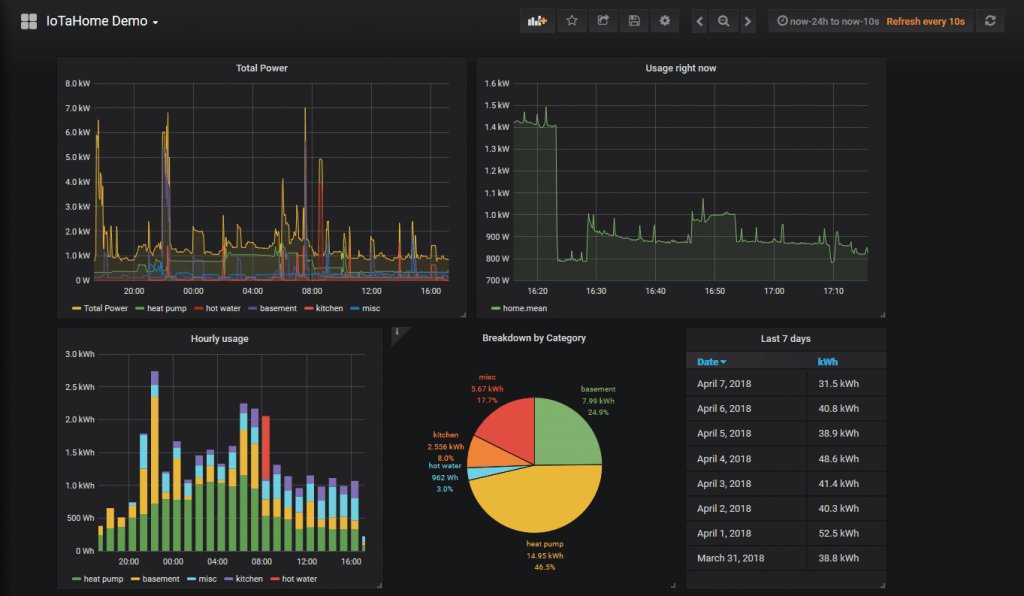
Visualize
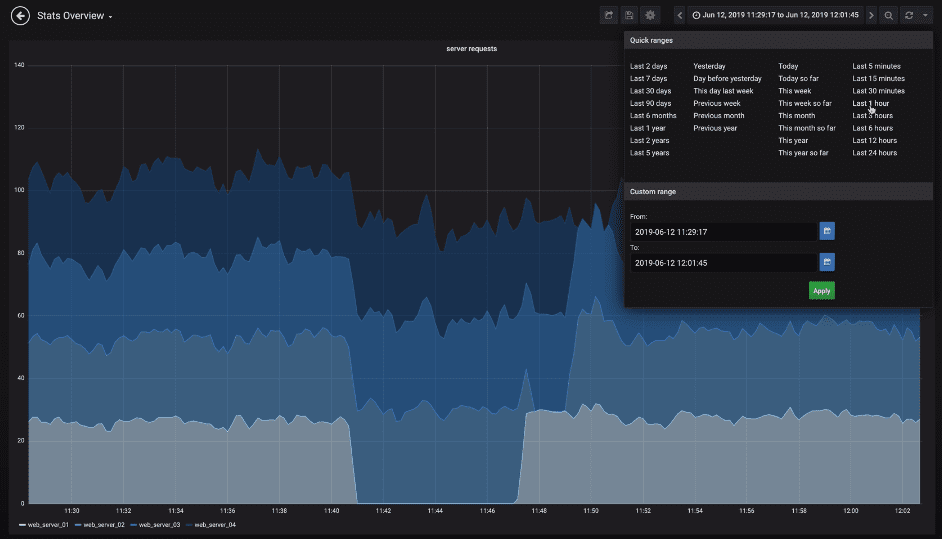
Fast and flexible client side graphs with a multitude of options. Panel plugins for many different ways to visualize metrics and logs.
Alerting
Visually define alert rules for your most important metrics. Grafana will continuously evaluate and send notifications to systems like graphite, influxdb, Prometheus, elasticsearch, and AWS CloudWatch.
Mixed Data Source
Mix different data sources in the same graph! You can specify a data source on a per-query basis. This works for even custom data sources.
Responsive Full Screen Panels and Dashboards
Automatically includes the current time range and variables. Create public or internal snapshots. Server side renders API make chat integration possible. Annotate graphs with rich events from different data sources. Hover over events shows you the full event metadata and tags.
Responsive Dashboards dynamically arranged for the best user experience on your phone, tablet, and computer!
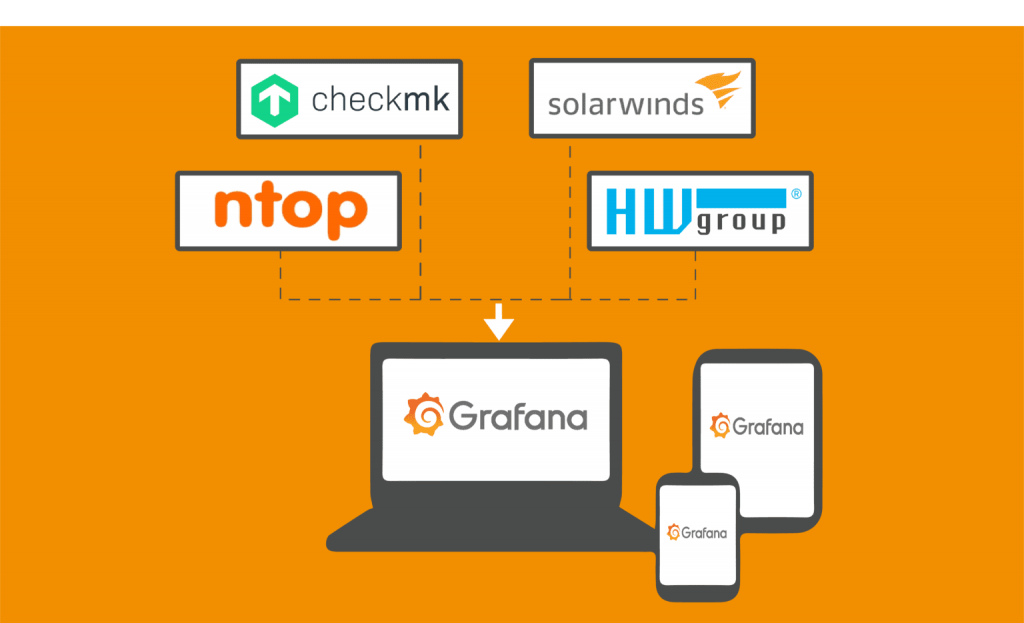
High Compatibility
Grafana is highly compatible with and integrates with Solarwinds, CheckMK, ntop and HWgroup. TruePath can enhance and offer stunning visualization to your networking data. Grafana also can aggregate your data from a collective of your work environments and offer setups for other platforms such as Splunk.
There’s an extensive list of Data source plugins available for a wide variety of networking devices and purposes.
Schedule A Grafana Demo
Experience in network monitoring is unquestionably our forte, and we’re also fans of stunning data visualization. These two aspects of our work tie-in gracefully with our Enterprise level Grafana support. Our engineers are excited to build new solutions from the ground up, or work on existing projects and help provide our guidance and professional expertise to your team!
We’ll arrange a live demo of the Grafana software. We can discuss and show you all the various features that Grafana has to offer:
- Dashboard configuration
- Software integration
- Aggregating multiple data sources
These are just the tip of the iceberg and if you’re looking for Check_MK software support? We can help.